Data Analytics Case Study

E-commerce
Retail Dashboard

A full-spectrum business intelligence project analyzing sales, profit, and product performance across global regions using Excel, Power Query, and Python.

42% Electronics Revenue
36% Accessories Margin
70% Less Manual Work
E-commerce Product Retail Dashboard Preview
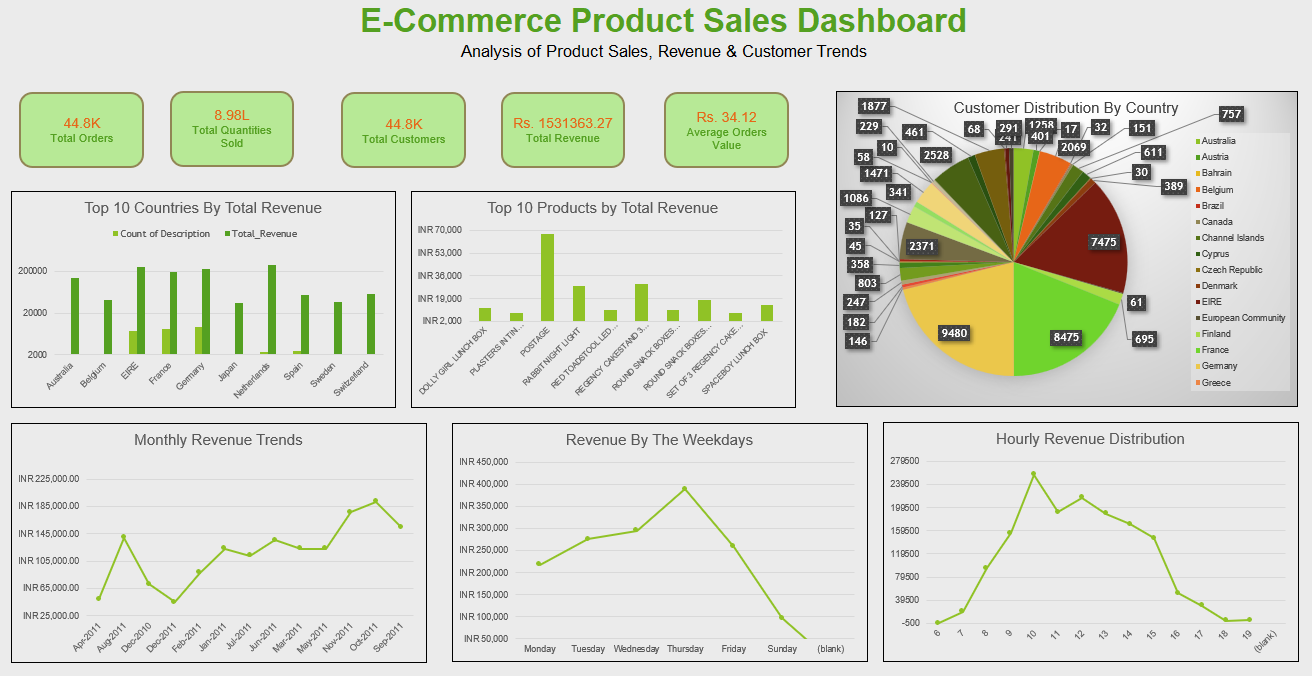
Interactive Dashboard Excel · Power Query · Pivot Charts

Problem Statement

The e-commerce company's data was fragmented across regions and product lines, making it impossible to track profitability trends at a category level. This project was built to answer three critical business questions:

Category Profitability

Which product categories are driving the highest revenue and profit margins — and which are undermining overall profitability?

Regional Performance

Which regions are performing at peak capacity, and where is the business significantly underperforming its potential?

Seasonal Trends

What seasonal sales patterns exist that can meaningfully shape future inventory planning and marketing budget allocation?

Data Fragmentation

Critical business data was siloed across multiple files, causing manual reconciliation bottlenecks and delayed decision-making cycles.

Dataset Description

Dataset Metadata

Source Internal Transactional Data
Type Structured, Transactional
Date Range Multi-year (incl. seasonal cycles)
Scope USA, Canada, Germany & more
Categories Electronics, Accessories, Clothing

Key Columns / Features

Order Date Time-series & seasonal trend analysis
Product Category Electronics, Accessories, Clothing
Region / Country Geographic origin of each sale
Revenue Total sales amount per transaction
Profit Margin Percentage profitability per line item
Cost Used to compute ROI and gross margin

Data Cleaning & EDA

The raw dataset went through a rigorous multi-step pipeline before any analysis was performed, ensuring data integrity throughout.

01

Data Cleaning & Preprocessing

  • Imputed missing categorical values and removed incomplete rows
  • Corrected date column types for time-intelligence in Power Query
  • Standardized currency formats across regional data files
  • Extracted Month/Year fields for seasonal pattern analysis
  • Calculated ROI and profit margins from raw revenue & cost data
Python (Pandas) NumPy Power Query
02

Exploratory Data Analysis (EDA)

  • Analyzed monthly sales trends to locate peak purchasing windows
  • Reviewed country-level sales distributions for geographic variance
  • Identified high profit-margin variance across product categories
  • Computed correlations between marketing seasonality and revenue spikes
Matplotlib Seaborn Excel Charts
03

Data Visualization

  • Built business-friendly dashboard focused on storytelling, not decoration
  • Created interactive Pivot Charts and Slicers for real-time exploration
  • Designed KPI tiles for Revenue, Profit Margin, and Region Growth
  • Integrated timelines for seasonal filtering by month/year
Excel Dashboards Pivot Tables
04

Automation & KPI Tracking

  • Connected Power Query to source data for automated refresh cycles
  • Reduced manual reporting time by 70% with pre-built templates
  • Tracked real-time KPIs: Total Revenue, Profit Margin, Regional Growth
Power Query (ETL) Power Pivot

Insights

This is the most important section of any data analysis project. These are the specific, measurable findings that drive real business value.

42%

Electronics Drives Revenue

Electronics alone generated 42% of the company's total revenue, making it the single most critical product category for top-line business growth. Any disruption in this category directly impacts the bottom line.

36%

Accessories = Highest Margin

Despite a lower revenue share, Accessories achieved a 36% profit margin — the highest of all categories. Top 20% of accessory products contribute to over 70% of total accessory profit, a clear Pareto principle in action.

Nov–Dec

Seasonal Revenue Spike

A significant and consistent revenue spike occurs during November–December, driven by holiday shopping. This seasonal effect is not evenly distributed — it disproportionately benefits Electronics and Accessories categories.

Top 3

USA, Canada & Germany Lead

These three regions collectively contribute the vast majority of international sales volume. The remaining international markets show high acquisition costs with disproportionately lower returns, signaling a need for strategic focus.

Recommendations

Think like a consultant. Based on the data findings, here are the concrete, high-priority actions the business should take to drive measurable growth.

1

Maximize Q4 Revenue with Inventory & Marketing Front-Loading

Given the proven Nov–Dec sales spike, increase Electronics inventory stocking by at least 30–40% before Q4. Allocate a higher share of the digital marketing budget to this window. Capture peak demand before competitors do.

2

Implement Electronics + Accessories Bundling Strategy

Since Electronics drives volume (42% revenue) and Accessories drives margin (36%), bundling them together is a proven mechanism to increase the average order value while boosting overall profitability per transaction.

3

Double Down on Customer Retention in Top 3 Regions

Prioritize customer lifetime value (CLV) programs in the USA, Canada, and Germany. Reducing churn by even 10% in these markets would yield a significantly higher ROI than acquiring equivalent new customers in underperforming markets.

4

Audit and Rationalize Underperforming International Markets

Conduct a market-by-market cost-to-revenue analysis beyond the top 3 regions. Consider consolidating spend from low-ROI markets toward proven high-performance regions or into product development to strengthen competitive position.

Tech Stack

Python

Pandas, NumPy, Matplotlib, Seaborn — data wrangling, EDA, and visualization

Microsoft Excel

Advanced Dashboards, Pivot Tables, Conditional Formatting, Dynamic Charts

Power Query

Data Extraction, Transformation & Load (ETL). Automated refresh workflows

SQL

Querying and aggregating transactional data for preliminary analysis

Power Pivot

Advanced data modeling and DAX measures for calculated KPI fields

Slicers & Timelines

Interactive filtering for real-time drill-down by region, category, and date

What's Included

Excel Dashboard

Fully interactive Excel file with Pivot Charts, Slicers, and automated refresh via Power Query

Download .xlsx

GitHub Repository

Clean, structured repo with full documentation, professional README, and all project assets

View on GitHub

PDF Case Study

Downloadable PDF summary including problem statement, insights, and strategic recommendations

Ready to Explore the Dashboard?

Download the full Excel dashboard or connect on LinkedIn to discuss the project and insights in detail.